

Product design / Instructional design
Designing the StepGuide.
- Role
- Instructional designer
- Contribution
- StepGuide flows & interactives
- Collaboration
- SMEs, product & engineering
- Context
- Maths practiceGrades 4–8
TL;DR
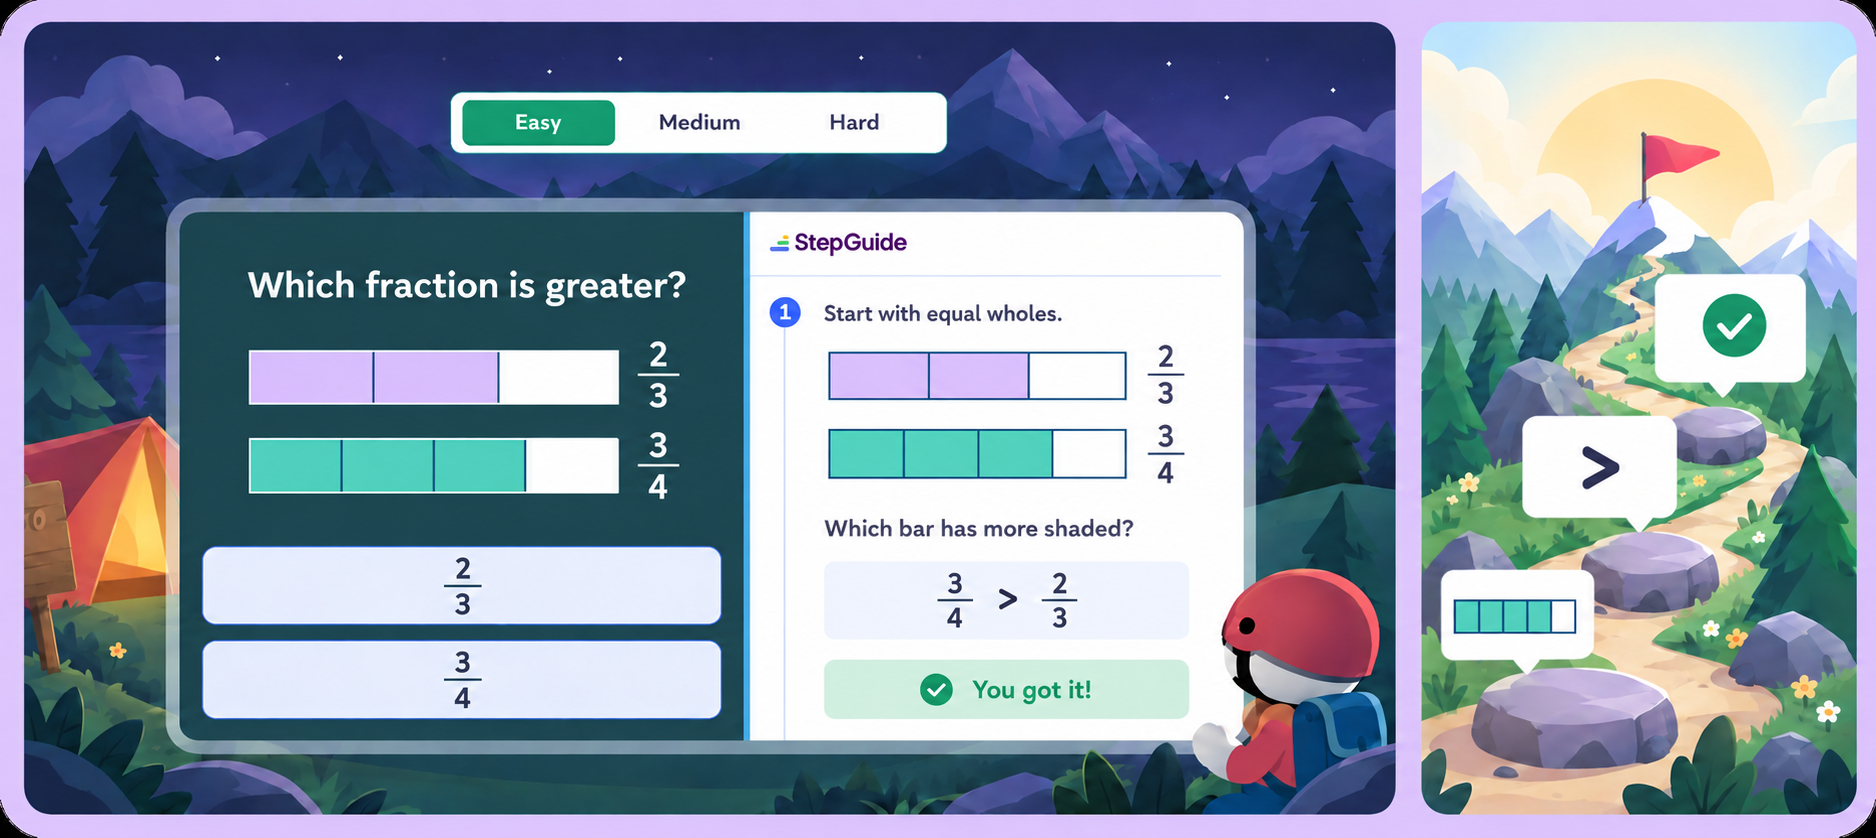
VoyageMath is Wayground’s math practice platform, designed to build students’ confidence with math. The crux of the product is StepGuide. When students get stuck on a math problem, it provides scaffolding: smaller steps that help them understand how to solve it.
The work focused on improving the existing guides: deciding what needed explaining and making word problems easier to interpret. I worked across 50+ subskills and shaped a reusable place-value interaction that shipped with engineering.
01 / Problem statement
How might we help children build the confidence
to solve math on their own?
VoyageMath grew out of concerns about learning gaps and students’ confidence with math after COVID disruptions.
A child might recognise a topic from class and still not know where to start. The work within the existing StepGuide focused on that moment: helping students understand what a question needed and make an attempt.
02 / Impact & reach
StepGuide’s impact.
VoyageMath’s reach.
StepGuide / Accuracy
Reported improvement in accuracy when students review mistakes through StepGuide.
VoyageMath / Product reach
- Students across U.S. schools
- 2M+
- Math questions practised each week
- 5.6M+
Company-reported figures for StepGuide and VoyageMath overall. Published results
03 / Try the interactive
Try the StepGuide.
Work through the smaller prompts to find the pattern’s rule and see how the guide connects back to the original math question.
Identify the rule for the pattern shown below.
Which rule makes the pattern?
A walkthrough of StepGuide’s Chromebook experience.
04 / Designing the support
Deciding what to explain in each math problem.
IXL was our main reference, alongside Khan Academy, Brilliant and classroom examples. We studied worked solutions for similar subskills to see how the reasoning unfolded and where a student might struggle. Within StepGuide’s existing one-step-at-a-time format, we worked from first principles: which concepts could we assume at their grade level, which needed a reminder, and what could students work out themselves? For longer problems, we grouped related steps to avoid tiring students during repeated practice.
Subject matter experts reviewed the math questions. We broke them down together and checked that the approach stayed mathematically sound as the designs developed. I owned how the guide unfolded: the prompts, visual explanations, and interactions.
Example / Comparing battery life
Deciding what needed support.
Three phone models had the same average battery life, so the average alone couldn’t tell students which was most consistent. The question depended on mean absolute deviation (MAD): lower MAD meant less variation.
The flashcard grouped words such as “consistent” and “reliable” under lower MAD. The first prompt asked students to make that connection. The next returned to the table with that relationship still visible. The guide clarified what “most consistent” meant; students still had to compare the values and choose a model.
Word problems
Before the maths,
there was the English.
Question data suggested that students were dropping off more often on word problems. Conversations with teachers helped us understand the difficulty: students had to translate the words into maths before they could work through the calculation.
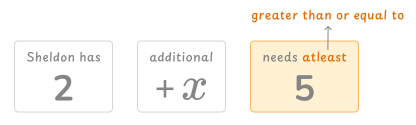
Each example needed a different visual emphasis: connecting phrases to quantities to form an equation, making the minimum in “at least” clear, or keeping the original price visible as the reference for percentage change. Flashcards grouped expressions with the same mathematical meaning. The text remained central to match the words-and-equations approach used in the U.S. classrooms we were designing for.
05 / Interaction design
Making the place-value
table interactive.
Mapping interaction needs across a new grade’s subskills showed several uses for a place-value table: reading whole numbers, comparing decimals, and expanded form.
We explored a single grid for place value and arithmetic. Both used cells, but they served different tasks: identifying what a digit represents and working through calculations. We separated the components so future changes could stay focused on the task each supported.
For place value, we chose responses inside the table over an image followed by a multiple-choice question. The digit, its position, and its label stayed together as students answered. I designed the component’s configurations and flow, working with engineering to ship it in StepGuide.
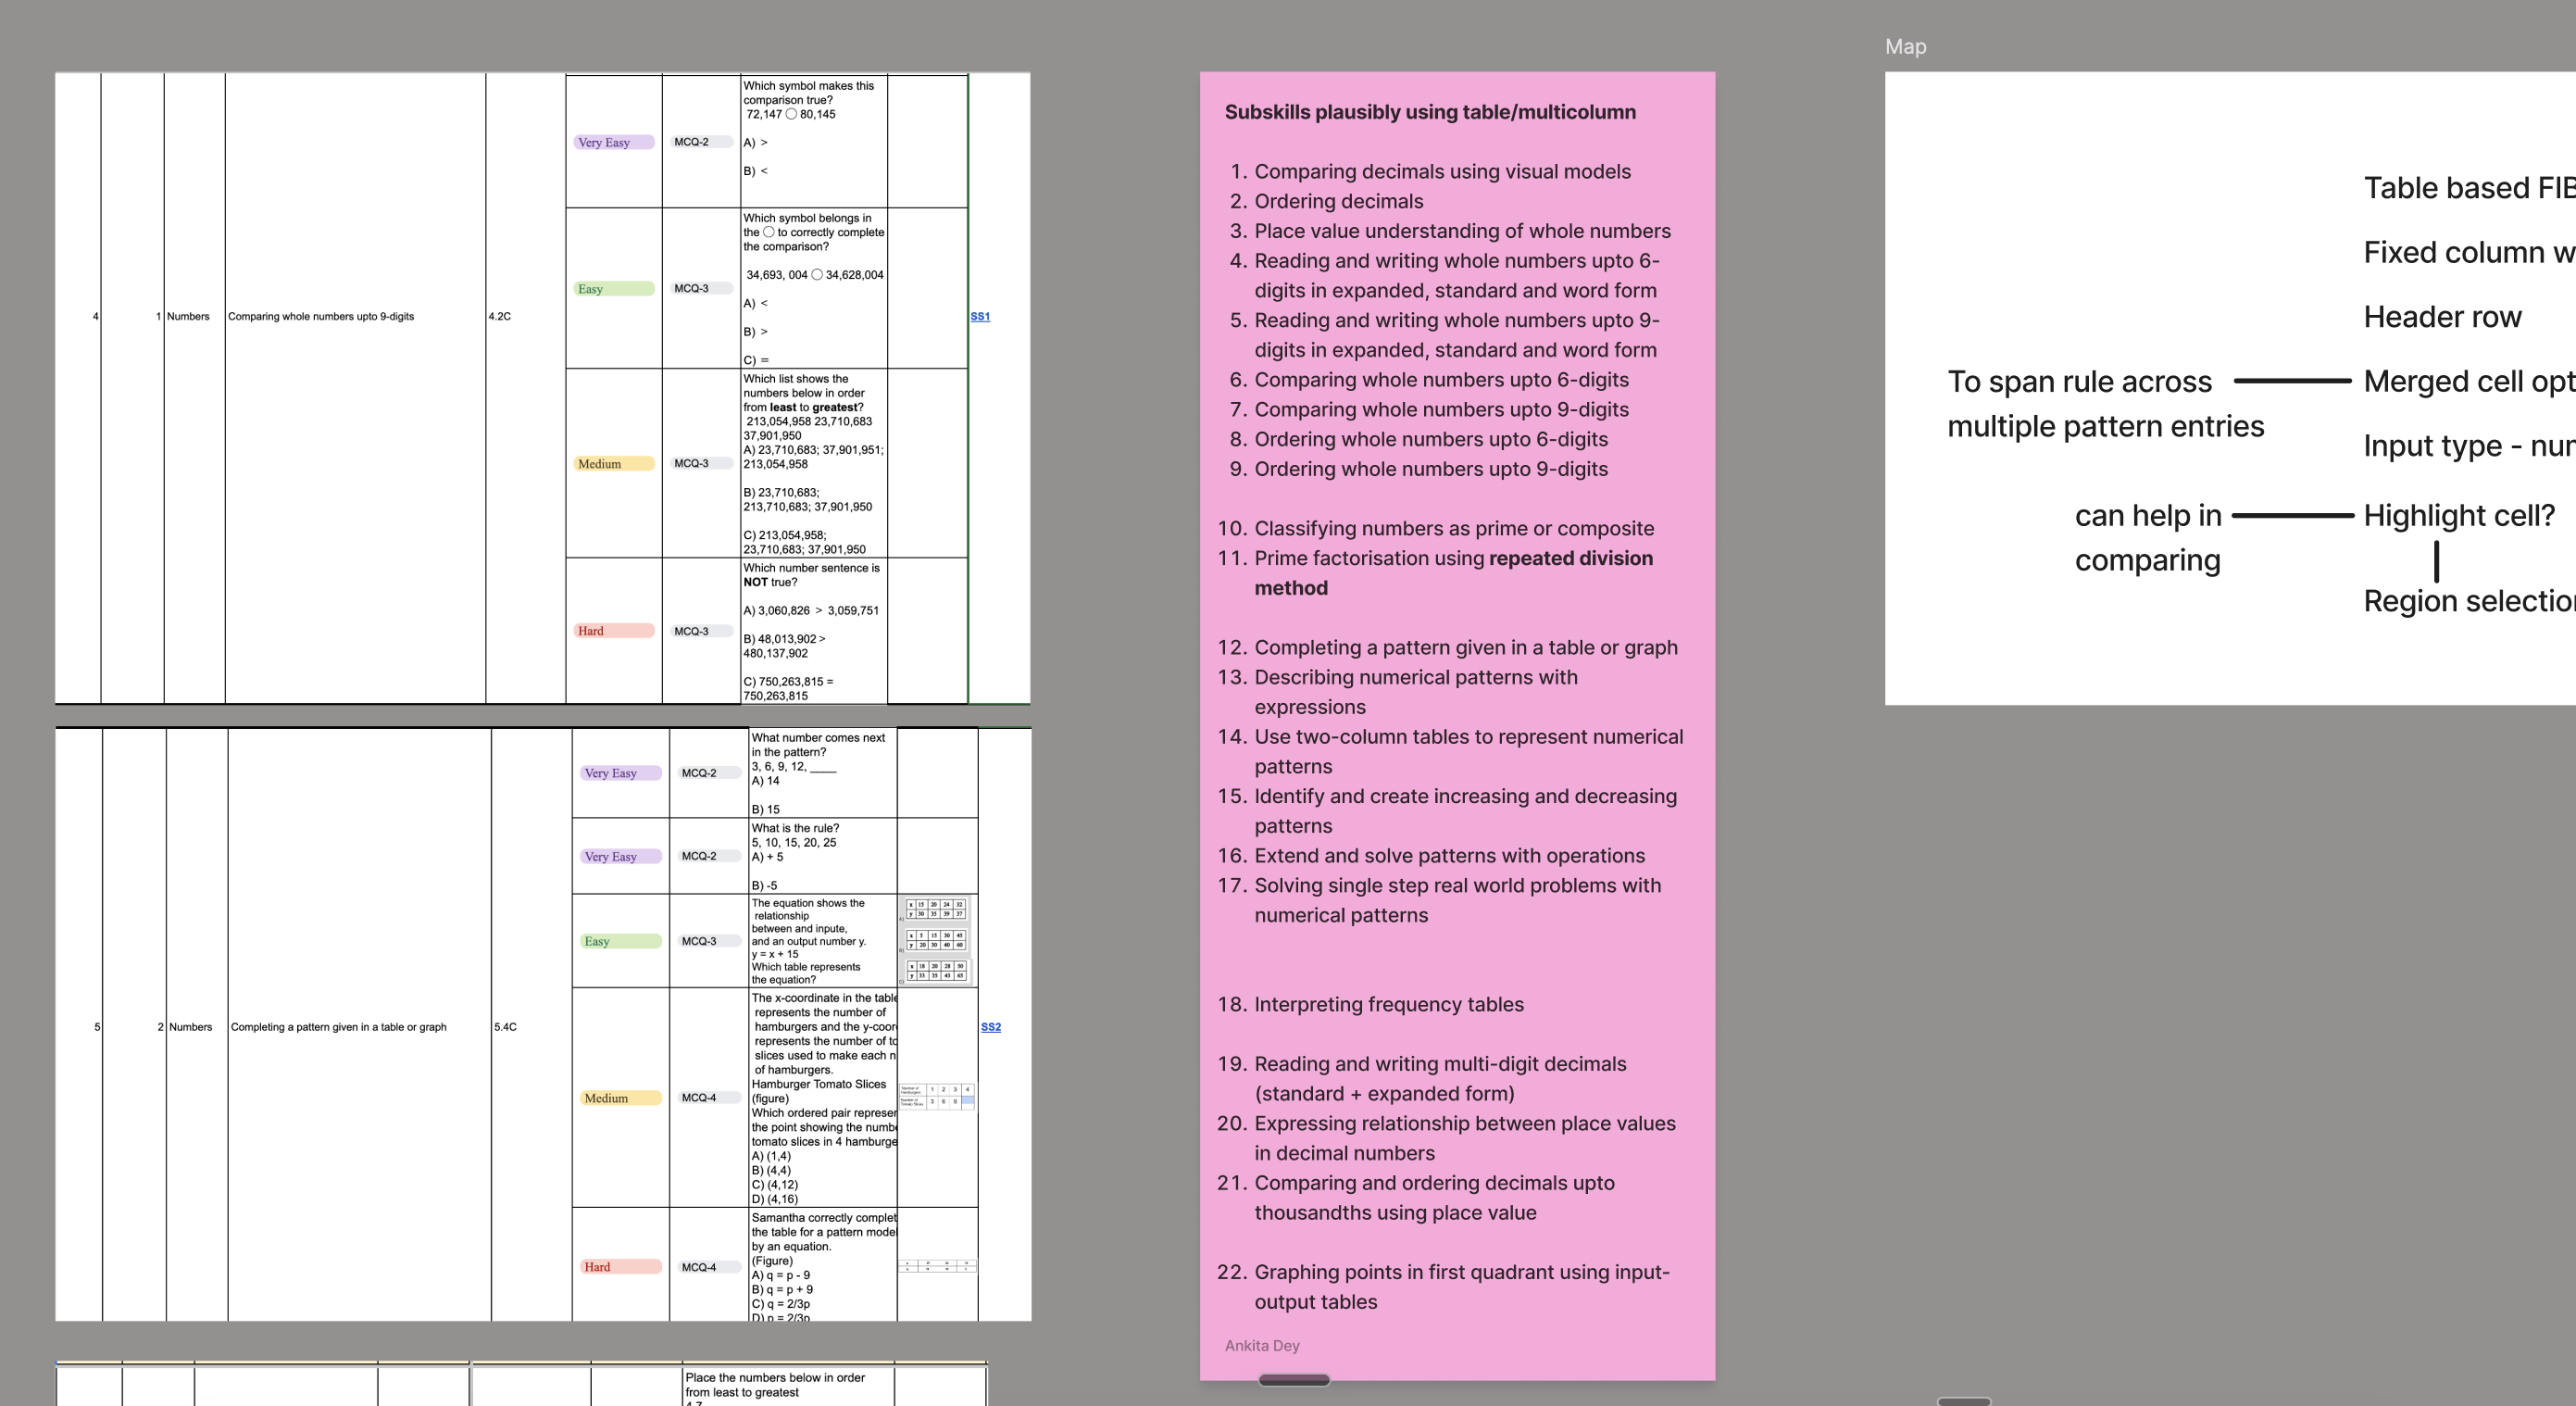
Subskills considered for a shared table, including place value, comparing numbers, and expanded form.
06 / Playtesting
Learning from
how students practised.
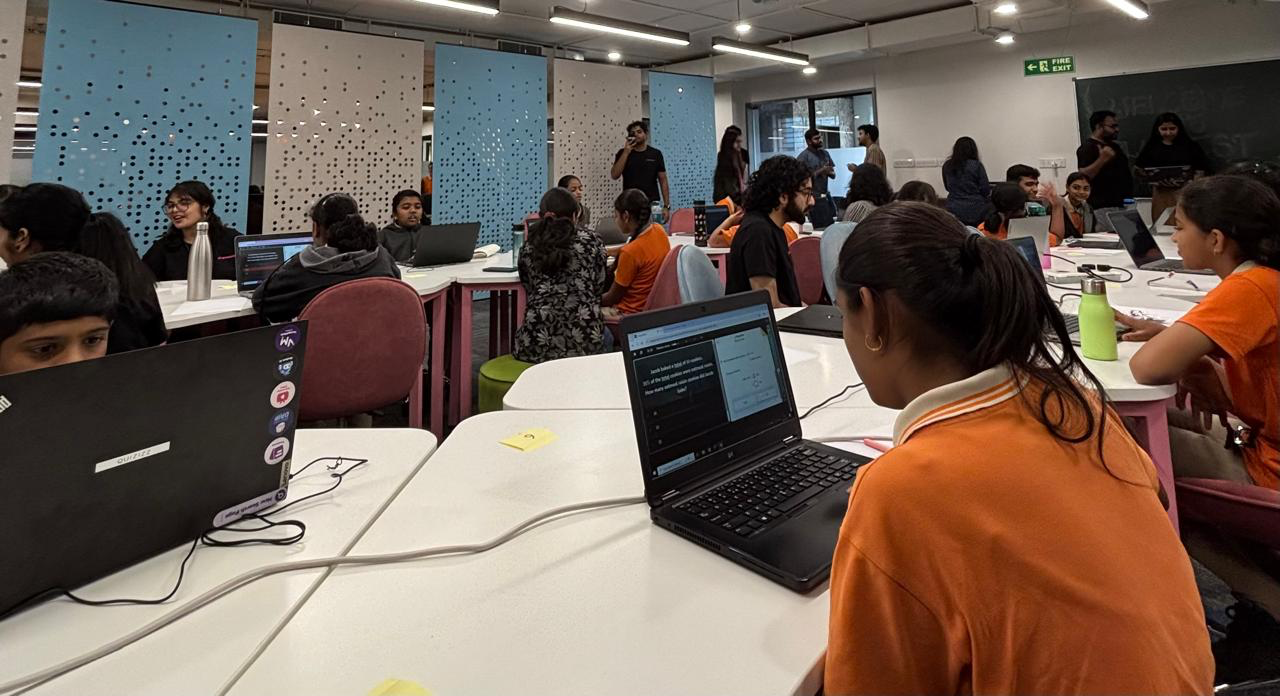
In the sessions I joined, children found their way around the product with little guidance. When stuck on a math question, we saw them use a flashcard and return to the problem without asking someone else for help. Earlier testing had led to shorter introductions after students skipped longer setups.
Although our participants in India were used to working on paper, they actively used StepGuide and reached for the paper provided mainly for small calculations. Some found the math approaches unfamiliar because the product followed the U.S. curriculum. Teacher reviews helped us understand the intended classroom context, where students used Chromebooks.
Children enjoyed dressing up their characters and exploring the game elements. Some continued answering math questions even when offered a mini-game break. In the second round, competing with friends became more prominent. Continued practice was encouraging, though the sessions could not separate enjoyment of the product from the motivation to compete.
07 / Behind the steps
Behind the steps.
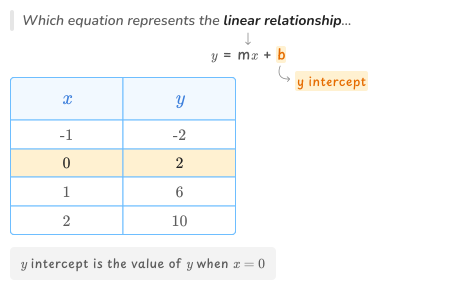
Find the intercept in the table.
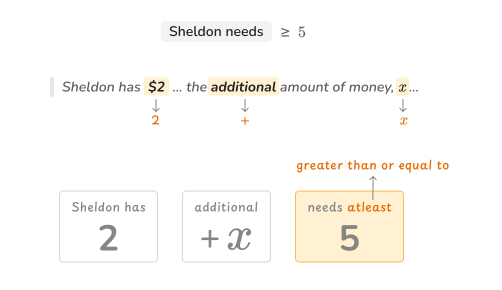
Turn “at least” into a boundary.
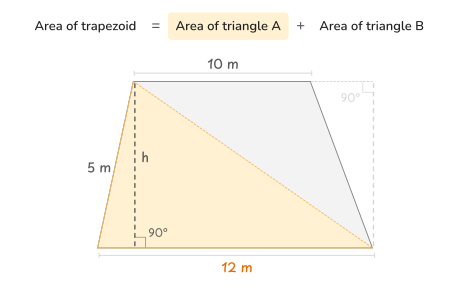
Split the shape into triangles.
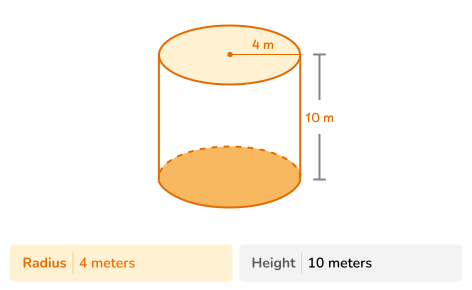
Keep radius and height distinct.
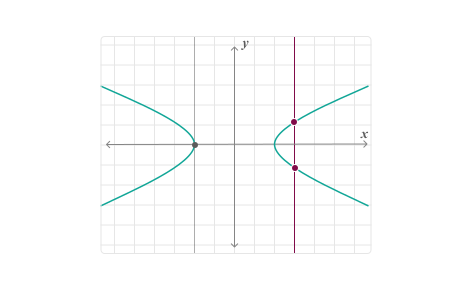
Show two outputs for one input.
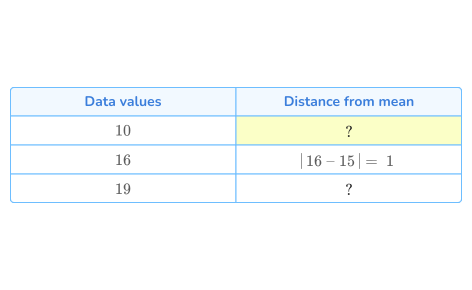
Show one example; leave the next.
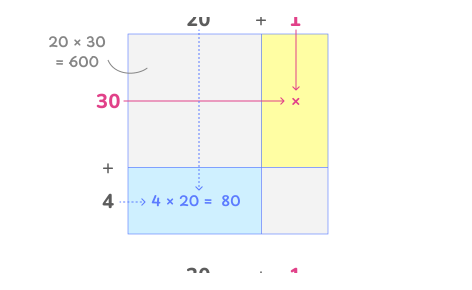
Split multiplication into place values.
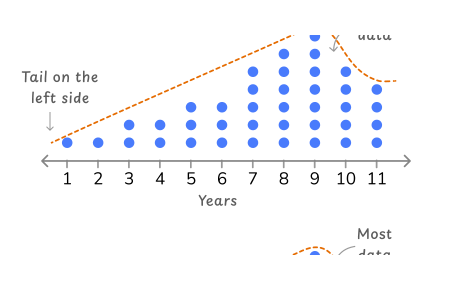
Separate the tail from the cluster.
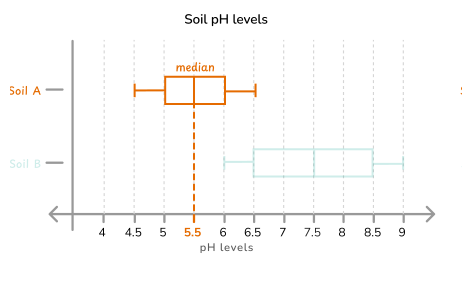
Isolate one median before comparing.
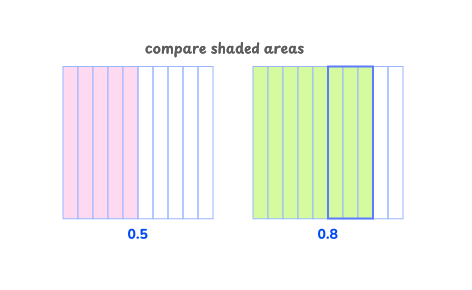
Compare quantities using equal wholes.
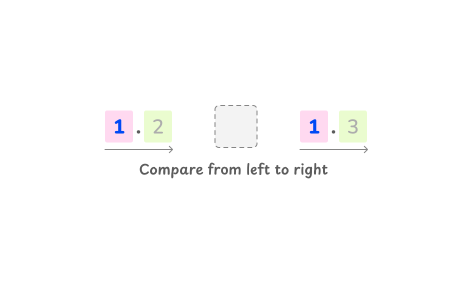
Compare place values left to right.
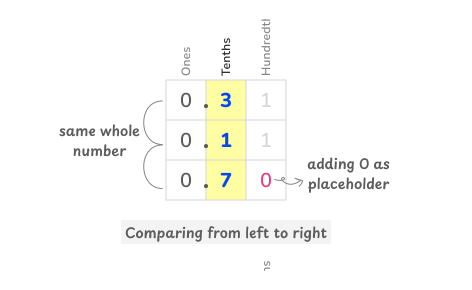
Make the zero placeholder explicit.
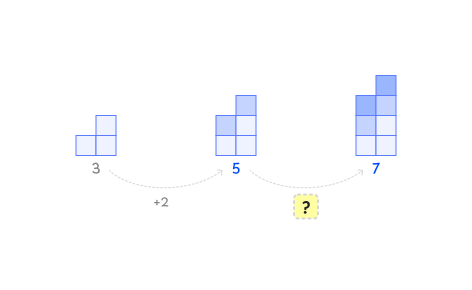
Show one change; ask for another.
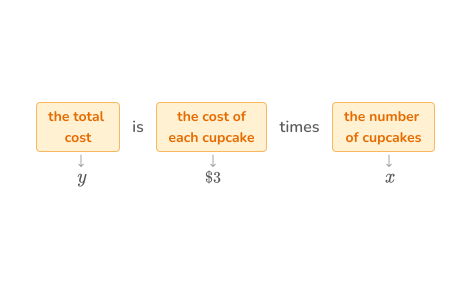
Connect words to mathematical meaning.
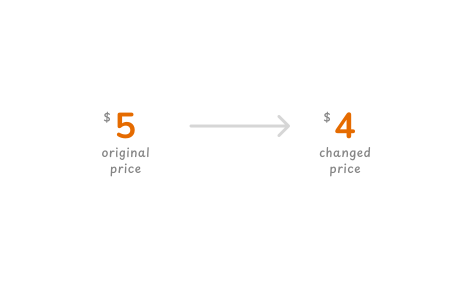
Show the change from the original.
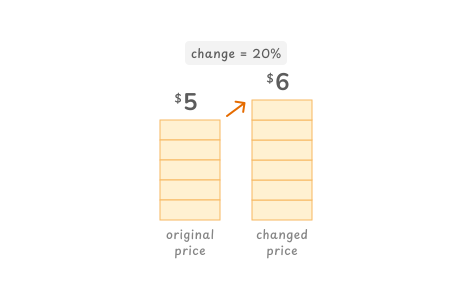
Keep the original five as reference.
08 / Reflection
Understanding that carries forward.
Word problems were especially rewarding for the challenge of translating language into maths. Building the place-value component was another highlight: a chance to shape a reusable interaction within the product.
Working across 50+ subskills taught me to judge each prompt or diagram by what it helped a child do: recognise a relationship, make an attempt, or apply a concept. Over repeated practice, the same diagrams and question patterns could become tiring, so I looked for variety and small moments of surprise. The existing easy-to-hard progression also helped me judge when to make reasoning visible and when to reduce support.
Completing a guide is one signal; carrying that understanding into the next question is another.